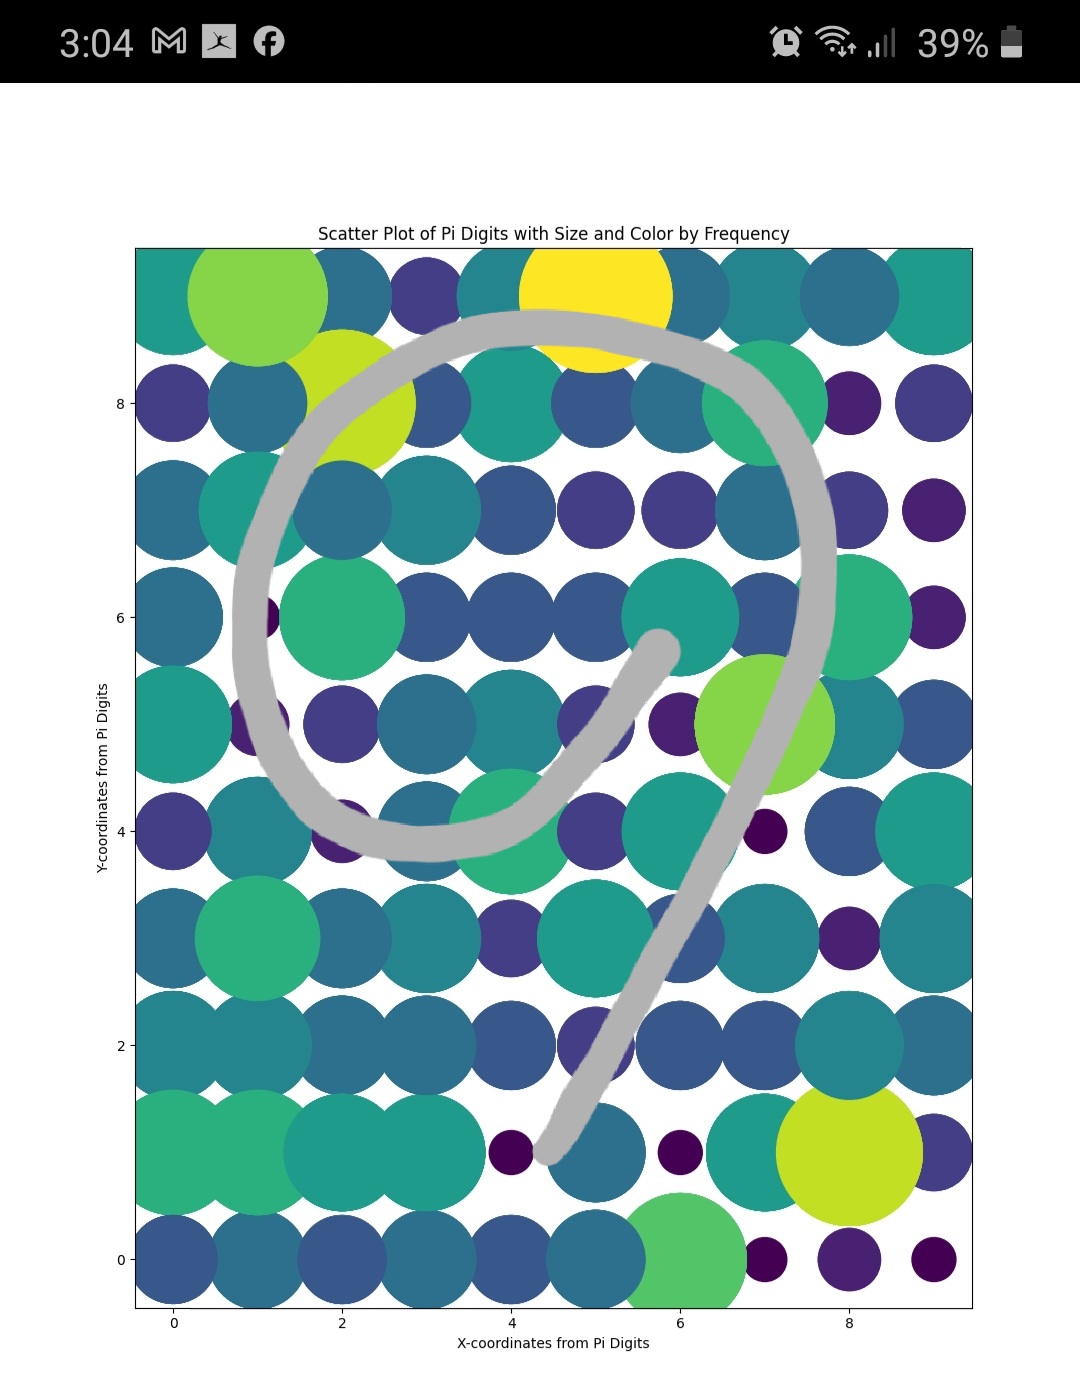
Continuing from my last blog post : I watched this video called "Pi is beautiful" and it inspired me to create my own pi art. With the help of my friend Bard I was able to get python code (or should I write pithon code) to get the job done. I sort of see a 9 as highlighted in the image above with gray pen tool. I used pydroid on my mobile and I had to correct a few errors in the code with Bard.
This was my prompt:
Take the first 1000 pi digits and create x,y coordinates with the adjacent digits and create a colorful visualisation with the coordinates. Increment the size and color everytime we land on a coordinate.
This was the code:
import matplotlib.pyplot as plt
import math
from PIL import Image
import io
# Get the first 1000 digits of pi
pi_digits = "141592..."
# Create coordinates and track frequencies
coordinates = []
frequency_map = {} # Use a dictionary to track frequencies efficiently
for i in range(0, len(pi_digits) - 1, 2):
pair = (int(pi_digits[i]), int(pi_digits[i + 1]))
coordinates.append(pair)
frequency_map[pair] = frequency_map.get(pair, 0) + 1000 # Increment frequency
# Create the scatter plot with size and colors based on frequencies
plt.figure(figsize=(10, 6))
plt.scatter(*zip(*coordinates), s=[frequency_map[pair] for pair in coordinates],
c=[frequency_map[pair] for pair in coordinates], cmap='viridis')
# Add labels and title
plt.xlabel("X-coordinates from Pi Digits")
plt.ylabel("Y-coordinates from Pi Digits")
plt.title("Scatter Plot of Pi Digits with Size and Color by Frequency")
# Show the plot
plt.show()


Comments